
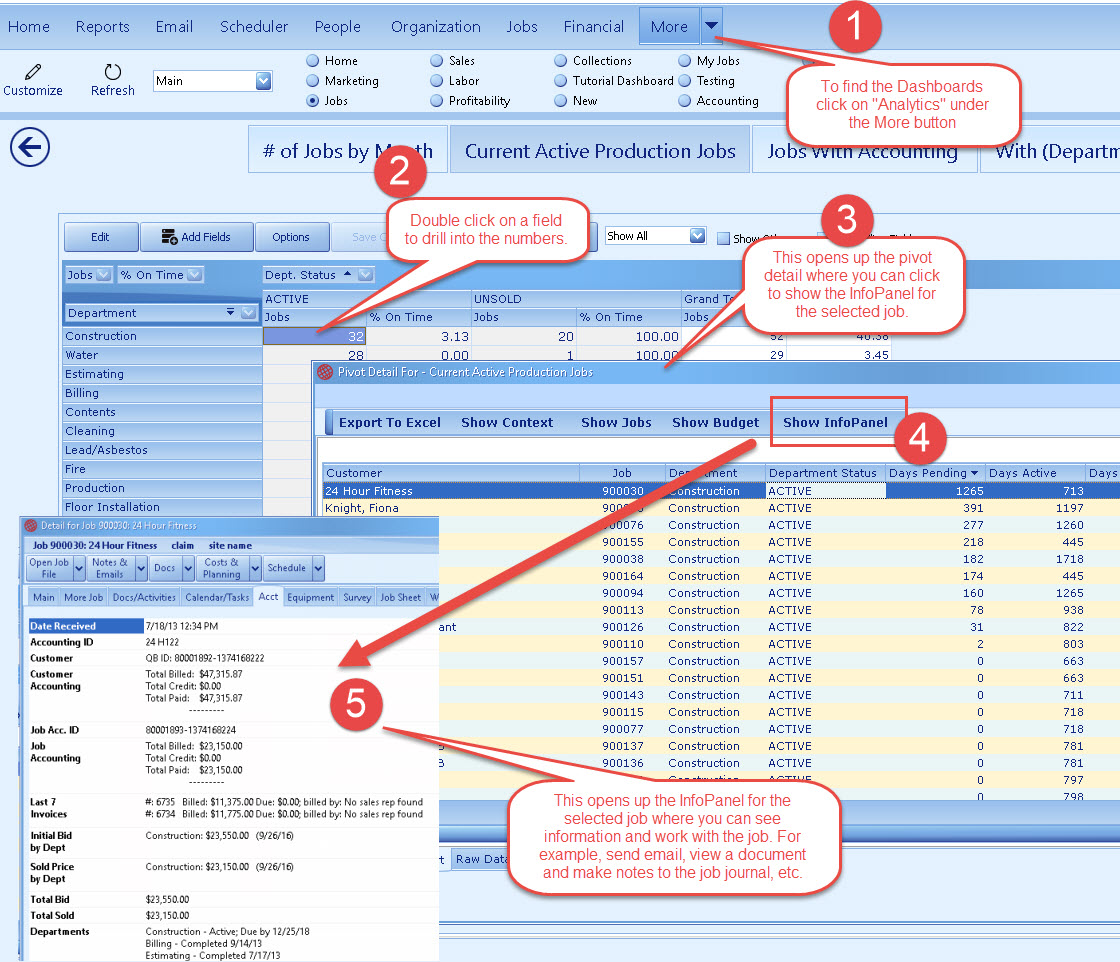
Once your create a dashboard tile, you then begin to look at the data by drilling in. Clicking on a number in the grid opens up a screen that list the jobs represented in the field. You can further drilling all the way a particular jobs InfoPanel and then work with the job by sending emails, looking at document, making notes to the file and many other features including opening the job itself.
Comments
0 comments
Please sign in to leave a comment.